Observability via Grafana
A comprehensive setup for monitoring Proxmox using Prometheus and visualizing metrics with Grafana.
Environment Overview
This setup consists of three main components:
- Grafana (Debian 13 LXC container) – for visualization
- Prometheus (Ubuntu LXC container) – for metrics collection
- Proxmox Host – monitored system, running the exporter
Prometheus Installation
A lightweight Ubuntu LXC container was created for Prometheus with the following specifications:
- Storage: 50GB
- CPU: 4 cores
- Memory: 8GB RAM
- IP Address: Static (192.168.1.14)
After deployment, standard system updates were carried out using:
apt-get update && apt-get dist-upgrade
Prometheus was then installed using:
apt-get install prometheus
Once installed, the config file was reviewed to confirm the listening port (default: 9090) and verified UP navigating to the port on a browser.
Grafana Installation
Grafana was deployed in a separate Debian 13 LXC container with:
- CPU: 2 cores
- Memory: 4GB RAM
- Disk: 10–20GB SSD
Installation followed using the official documentation found here:
https://grafana.com/docs/grafana/latest/setup-grafana/installation/debian/
After installation, the Grafana service was enabled to start on boot using the following:
systemctl enable grafana-server
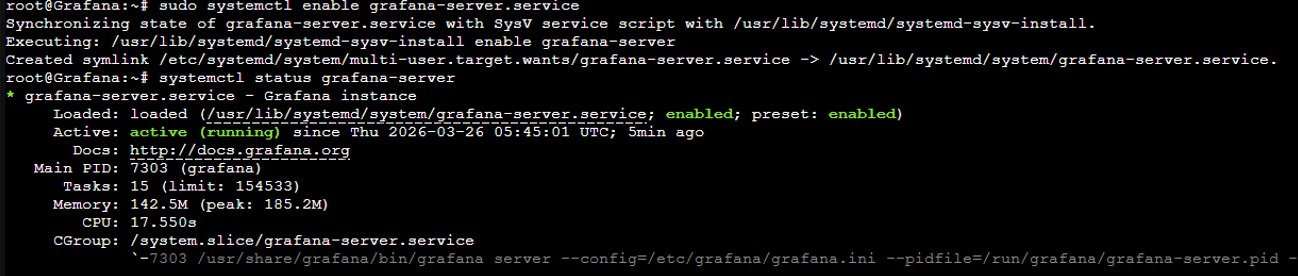
Grafana runs by default on port 3000, which was verified by browsing to also.

Connecting Prometheus & Grafana
Grafana was configured to use Prometheus as a data source by pointing it to:
http://192.168.1.14:9090
At this stage, Prometheus was only monitoring itself using the default node exporter, which isn’t going to tell us much valuable information. To collect metrics from the Proxmox host, the prometheus-pve-exporter was installed directly on the Proxmox machine.
An API user and token were created within Proxmox to allow secure metric collection. A configuration file (pve.yml) was created on the Proxmox host:
default:

  user: prometheus@pve

  token_name: prompve-scraper

  token_value: XXXXXXXX-XXXX-XXXX-XXXX-XXXXXXXXXXXX
This file is used only by the exporter, not by Prometheus.
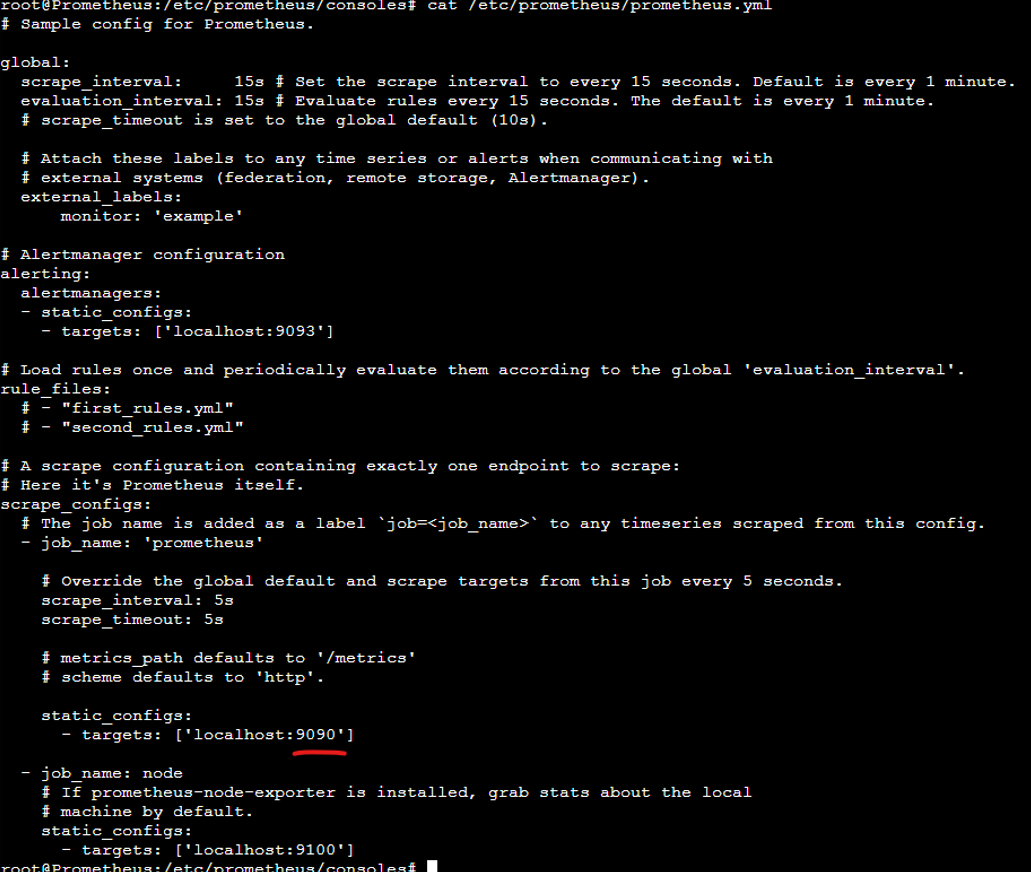
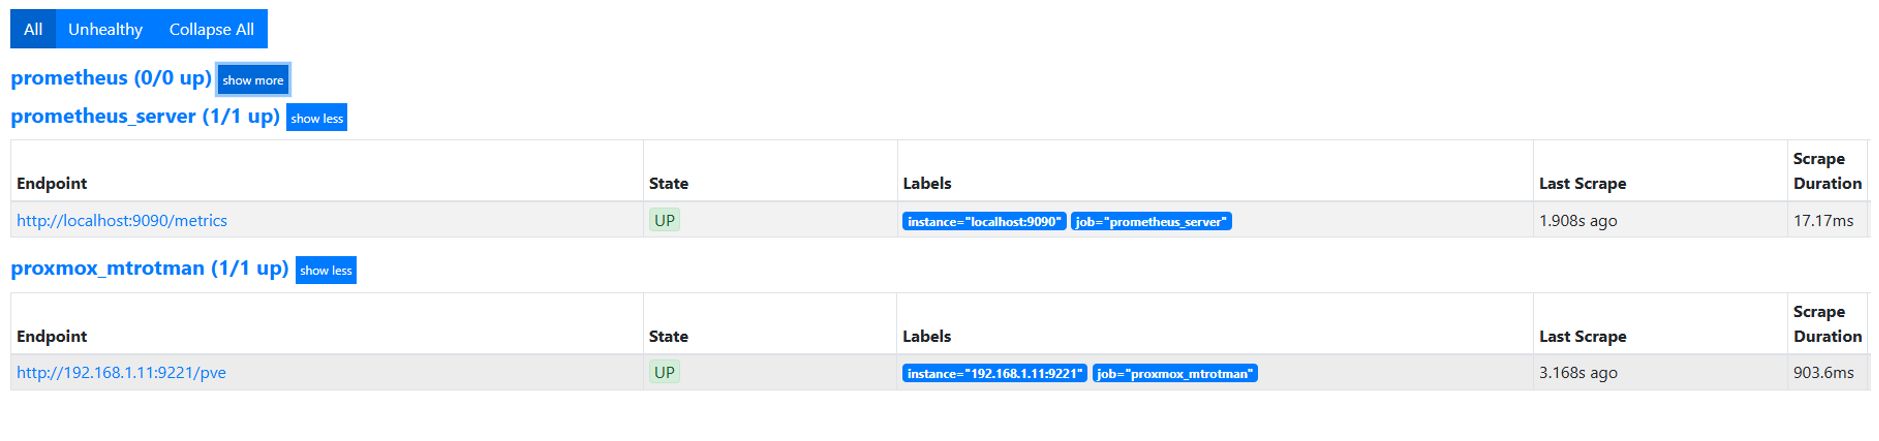
Configuring Prometheus to Scrape Proxmox Metrics
Once the prometheus-pve-exporter is running on the Proxmox host, Prometheus needs to be configured to scrape metrics from it. This was done by editing the prometheus.yml config file and adding a new scrape job:
- job_name: 'proxmox_mtrotman'

  static_configs:

    - targets:

      - '192.168.1.11:9221'  # Proxmox VE node exporter endpoint


  metrics_path: /pve
This now showed as up:
How This Fits Into the Architecture
With this configuration in place:
- Prometheus should send a request to:
http://192.168.1.11:9221/pve - The exporter:
- Authenticates with the Proxmox API using the API token
- Collects relevant metrics
- Returns them in Prometheus format
- Prometheus:
- Scrapes and stores the data
- Makes it available for querying
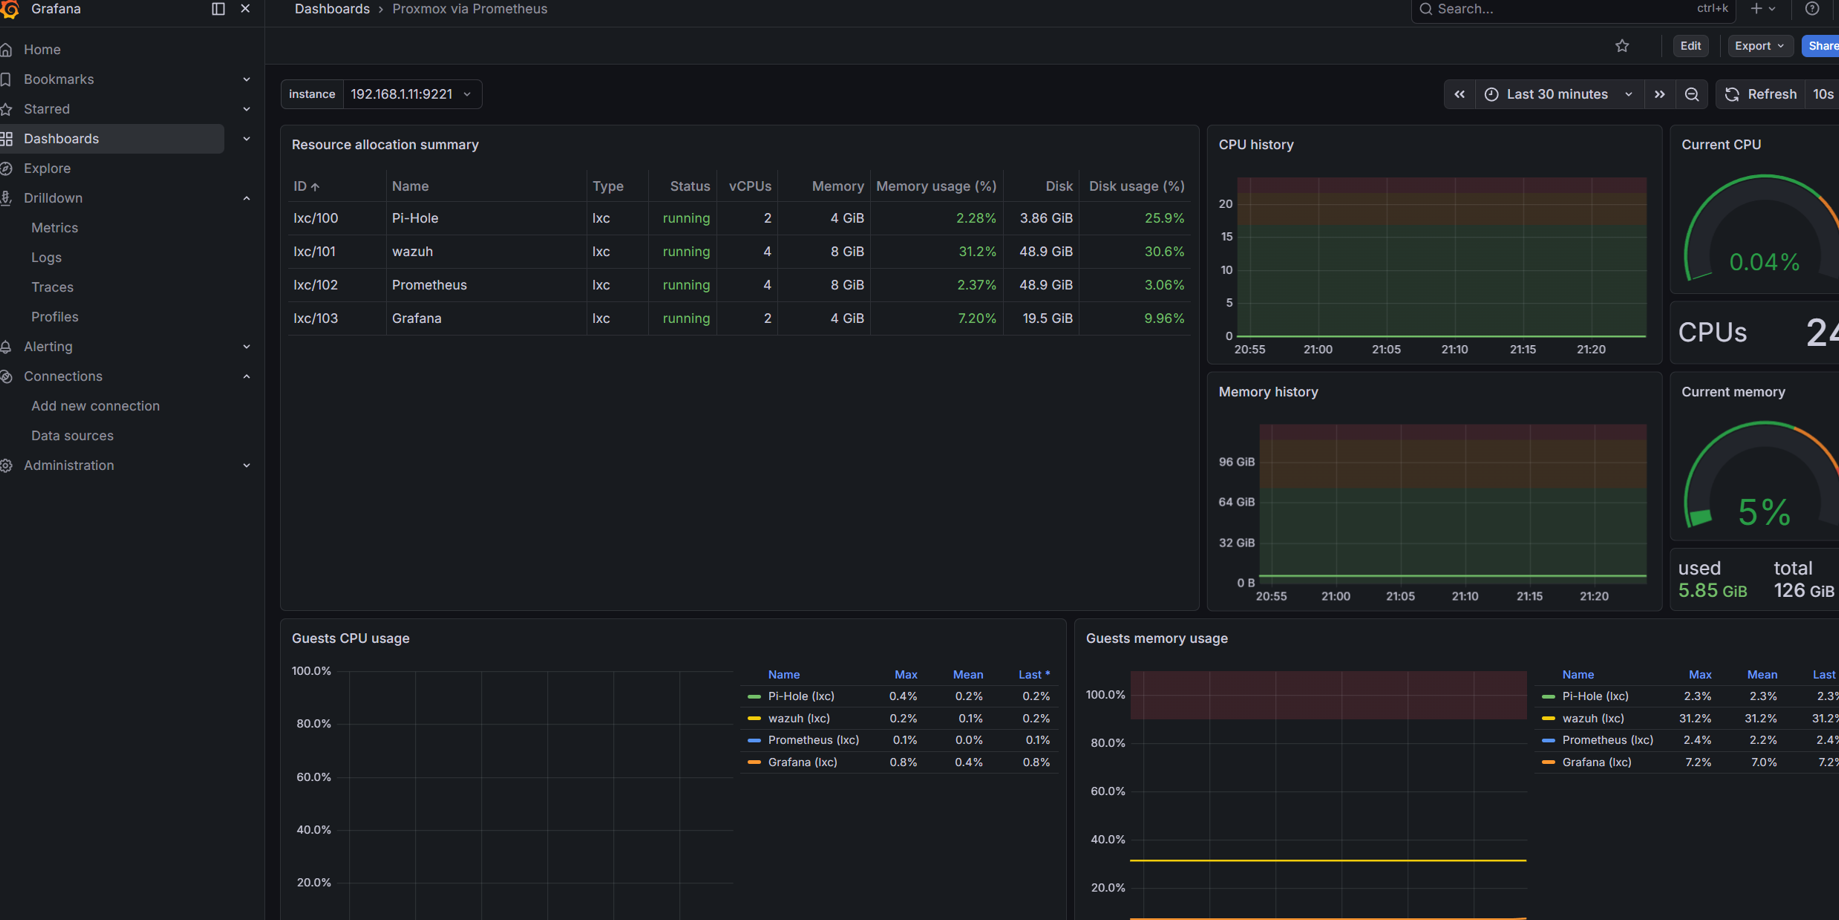
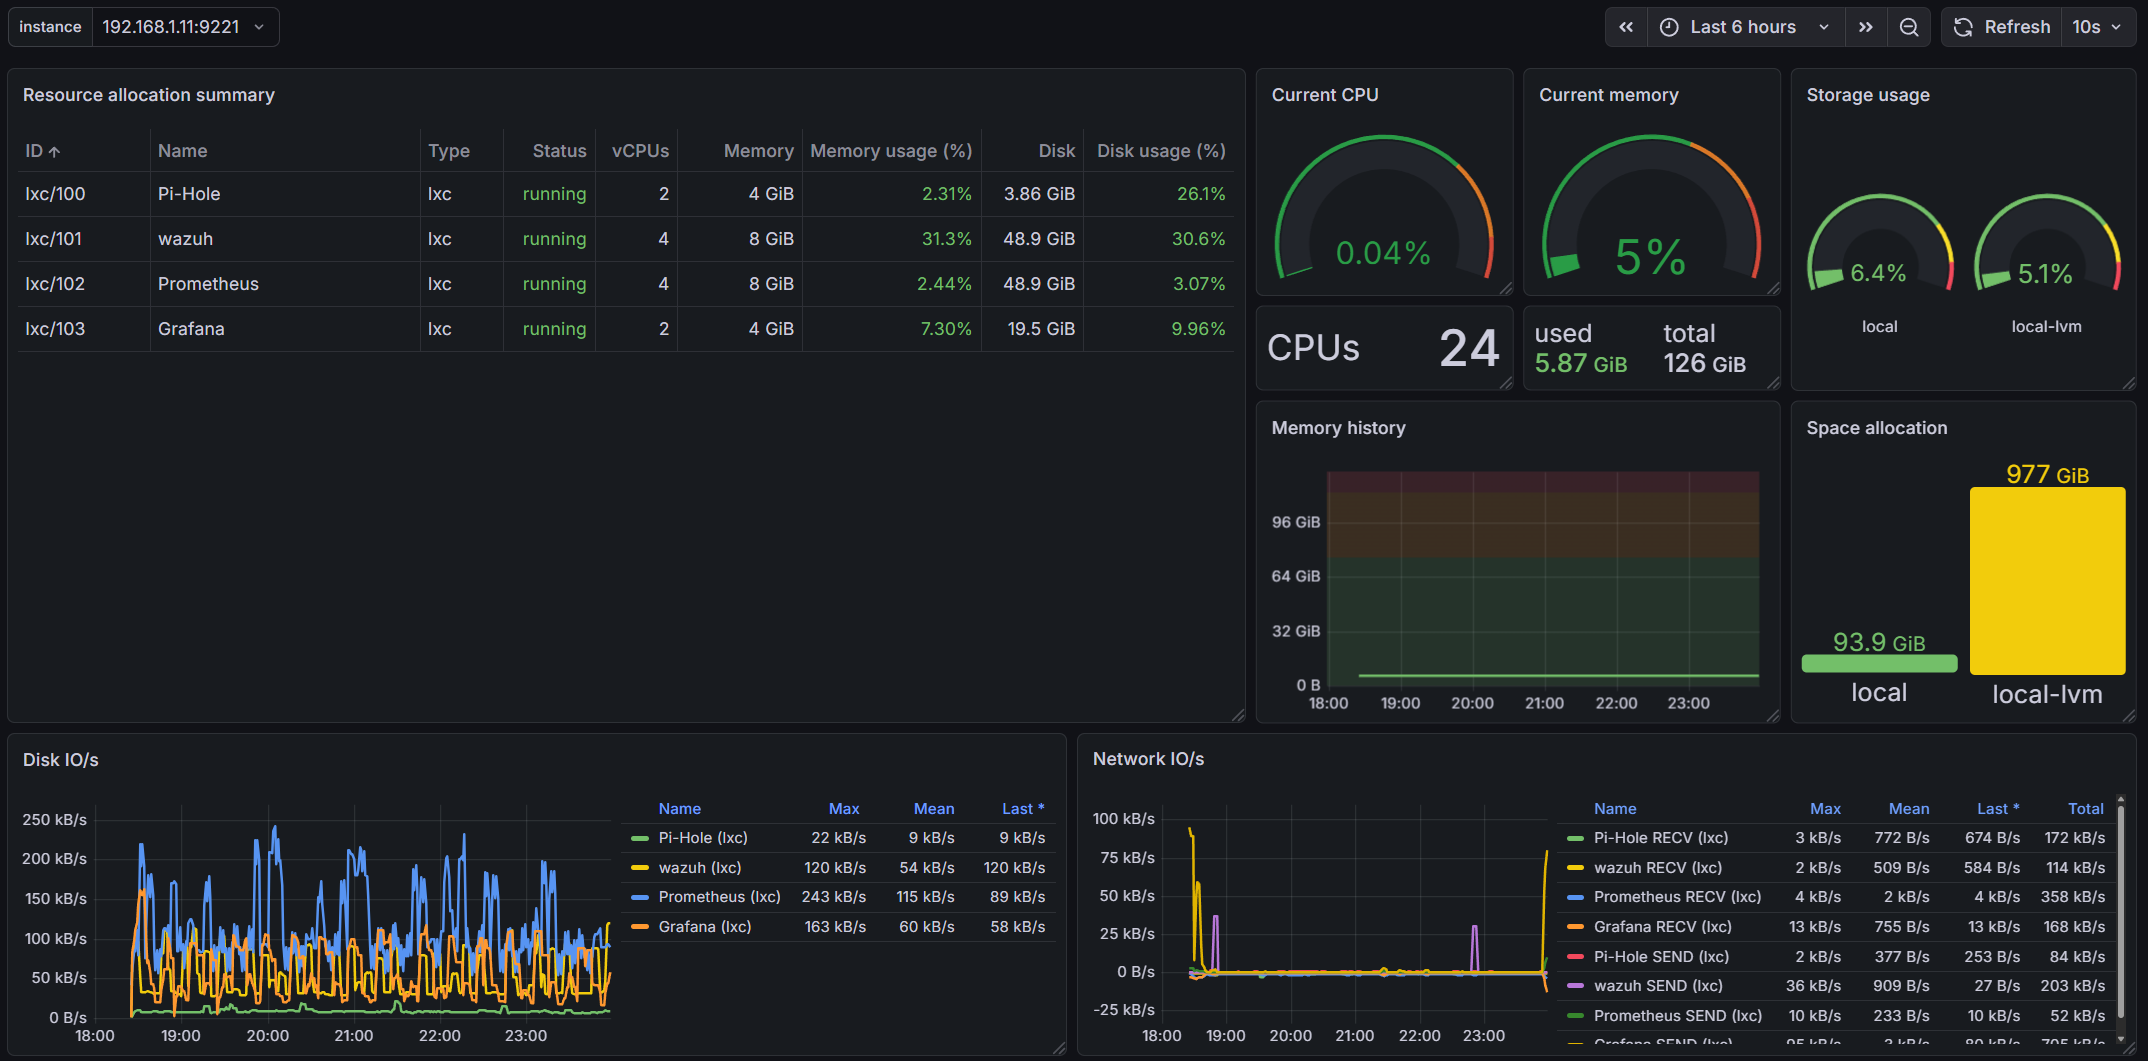
Visualising Metrics in Grafana
Once Prometheus was successfully scraping the exporter, Grafana can be used to visualise the collected data. A pre-made dashboard was used for this which can be found using the ID 10347.